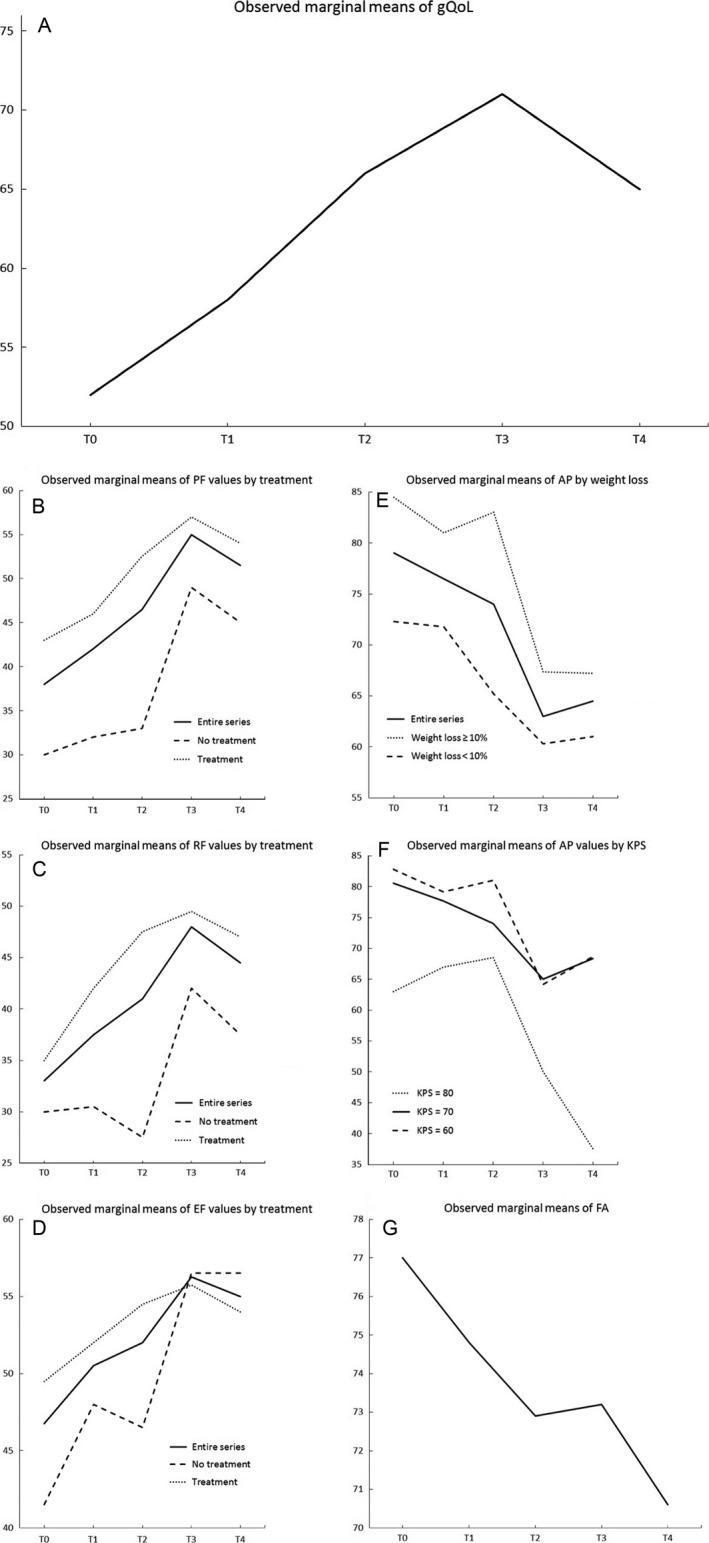
Figure 2.

Patients’ scores for the EORTC QLQ‐C30 scales at different time‐points. Scores (range from 0 to 100) are depicted, as observed marginal mean by single time‐point, for the independent time series that had a statistically significant trend over time at univariate mixed‐effects linear models for repeated measures. Determinants significantly associated at the univariate analyses with changes in trend over time are showed. In figures A, B, C and D higher scores indicating better QoL. In figures E, F, and G lower scores indicating better QoL. T0, at the HPN start; T1, after 1 month; T2, after 2 months; T3, after 3 months; T4, after 4 months; EORTC QLQ‐C30, European Organization for Research and Treatment of Cancer Quality of Life Questionnaire‐Core 30; gQoL, global Quality of Life; PF, physical functioning; RF, role functioning; EF, emotional functioning; AP, appetite loss; KPS, Karnofsky performance status; FA, fatigue.
