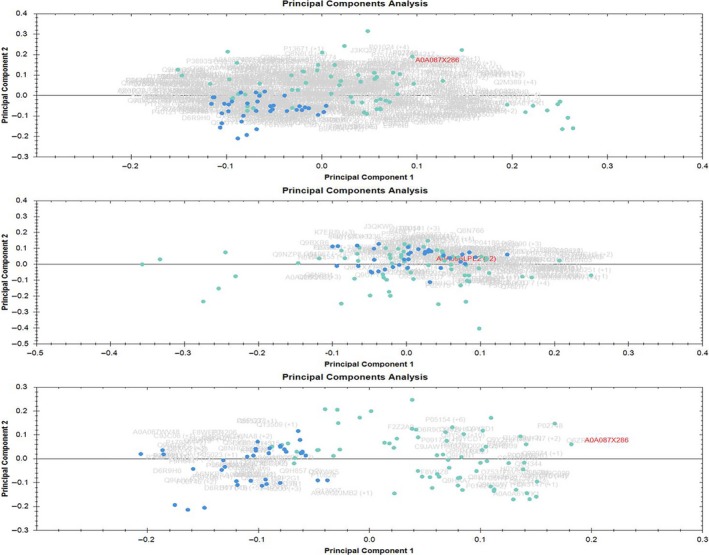
Figure 1.

Principal component analysis (PCA). Blue dots are samples of chronic pancreatitis and cyan dots are samples of pancreatic cancer. Each sample was run in triplicates. Upper panel is when the PCA was performed on all proteins with one or more unique peptides and middle panel is when proteins having the fold change of 1.0‐1.3 between the two conditions (housekeeping proteins) were used for PCA. Lower panel depicts the PCA when proteins passing the cutoff of 0.05 for ANOVA were used for PCA.
