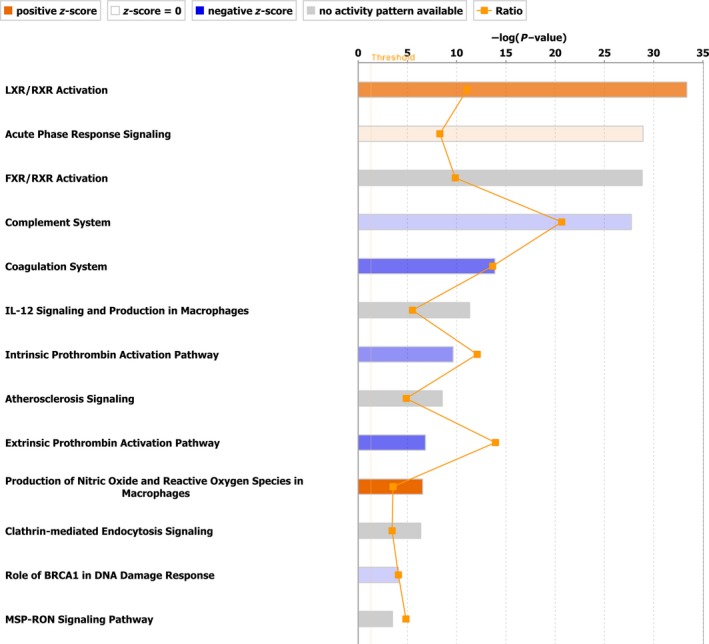
Figure 5.

Canonical pathways enriched by core analysis in IPA. Top canonical pathways enriched by Ingenuity Pathway Analysis “Core analysis” are shown here. Straight orange vertical line running through the bars is threshold for P value for the particular pathway's enrichment. Horizontal axis is the –log (P value) and vertical axis represents the given pathways.
