
Figure 1.
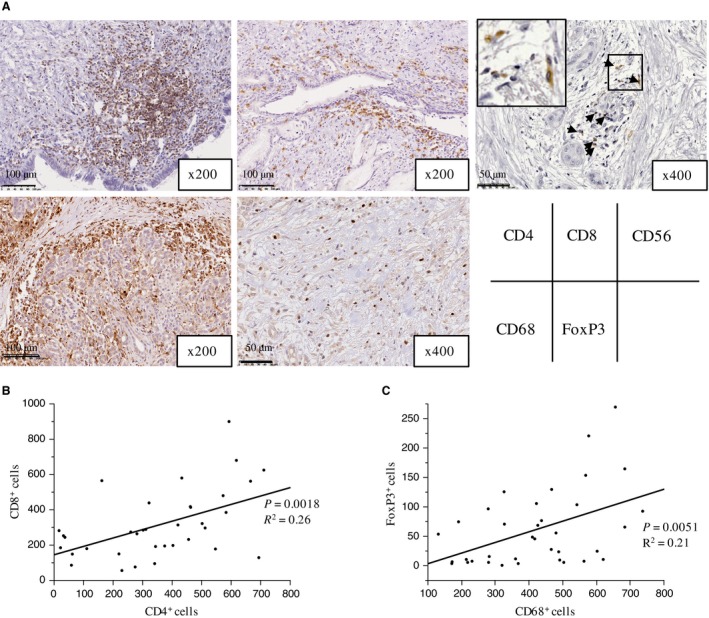
Immune cell infiltrates in primary PDA lesions. (A) Representative images for CD4, CD8, CD56, CD68 and FoxP3 immunohistochemistry in primary PDA lesions. (B) Association between the number of tumor‐infiltrating CD4+ cells and CD8+ cells. (C) Association between the number of tumor‐infiltrating CD68+ cells and FoxP3+ cells. The number of positive cells shown is the total number of positive cells within three high‐power fields.