
Figure 2.
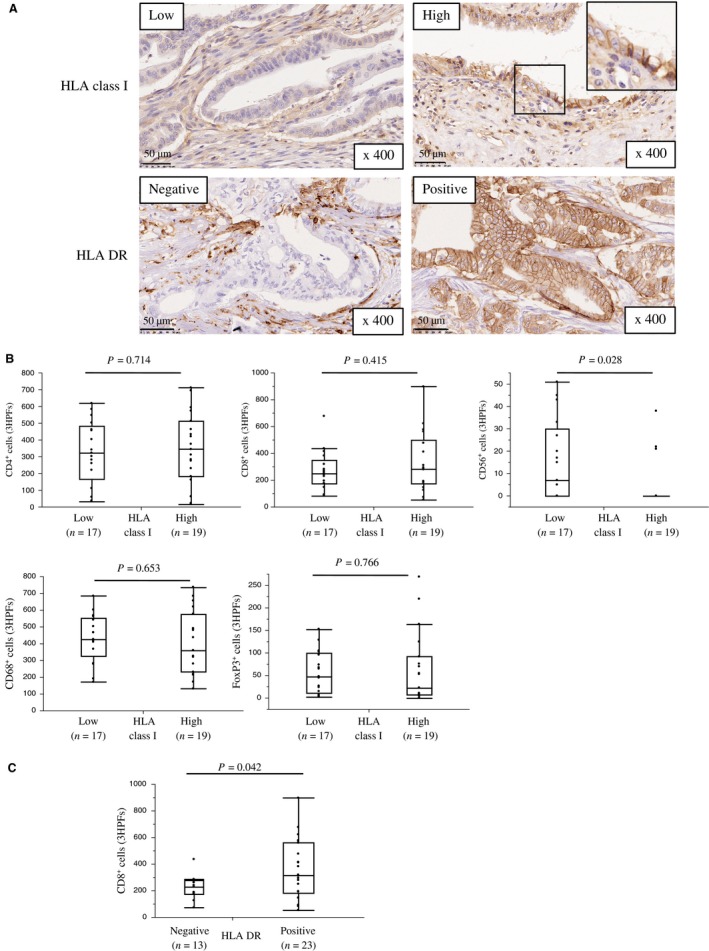
HLA expression and the association between HLA expression and immune cell infiltrates in primary PDA lesions. (A) Representative staining patterns for HLA class I and HLA‐DR immunohistochemistry in primary PDA lesions. (B) Association between HLA class I expression and the number of tumor‐infiltrating cells. (C) Association between HLA‐DR expression and the number of tumor‐infiltrating CD8+ cells. On each box, the central mark is the median, and the edges of the box are the 25th and 75th percentiles. Dots represent individual patients. The number of positive cells shown is the total number of positive cells in three high‐power fields.