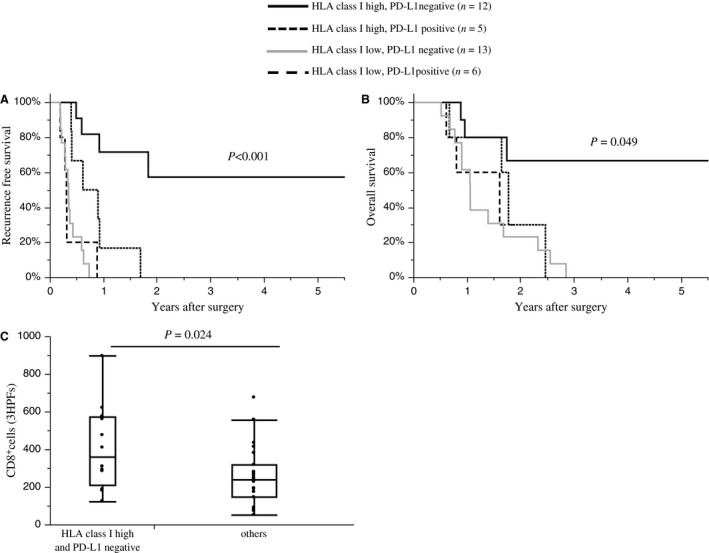
Figure 5.

The expression patterns of HLA class I and PD‐L1 and the survival outcomes of PDA patients. Recurrence‐free survival rates (A) or overall survival rates (B) in PDA patients sorted by of HLA class I and PD‐L1 expression: HLA class I high/PD‐L1 negative, n = 12 (solid lines); HLA class I high/PD‐L1 positive, n = 5 (dotted lines); HLA class I low/PD‐L1 negative, n = 13 (gray line); HLA class I low/PD‐L1 positive, n = 6 (dashed line). (C) The number of tumor‐infiltrating CD8+ lymphocytes in PDA patients divided into two groups: HLA class I high/PD‐L1 negative, n = 12; and the remaining patients, n = 24. The number of positive cells shown is the total number of positive cells in three high‐power fields.
