
Figure 1.
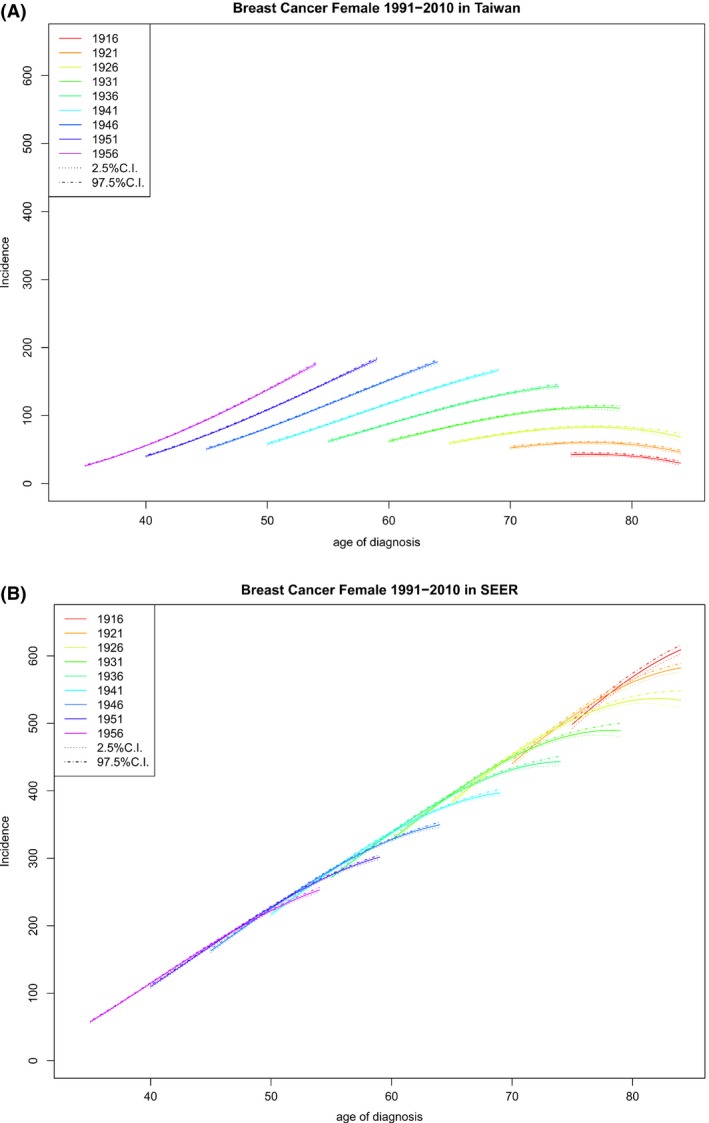
Age‐specific rates by year of birth (rates vs. age of diagnosis, observations within each birth cohort are connected) and their 95% credible intervals. (A) Age‐specific rates by year of birth for Taiwan. (B) Age‐specific rates by year of birth for US SEER‐9.