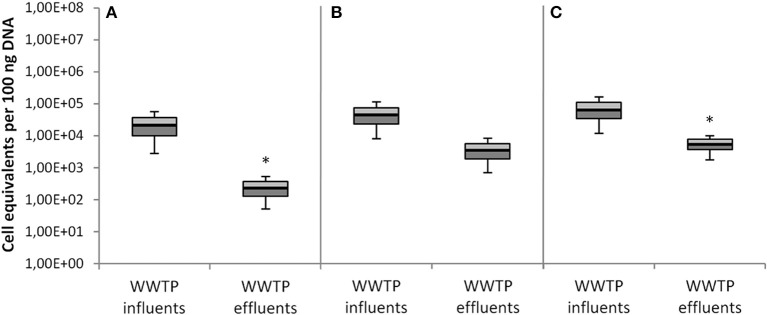
Figure 6.
Abundances of taxonomical marker genes per 100 ng of total extracted DNA from all 7 WWTPs. (A) A. baumannii was detected by secE gene abundance, (B) K. pneumoniae was detected by gltA gene abundance, and (C) E. coli was detected by yccT gene abundance. Displayed are the median values as well as the quantils [p = 0.25 (dark), p = 0.75 (bright)] and the standard deviations (n = 14). Significance of reduction is assessed by student's t-test with p ≤ 0.05 and are indicated by asterisk.

