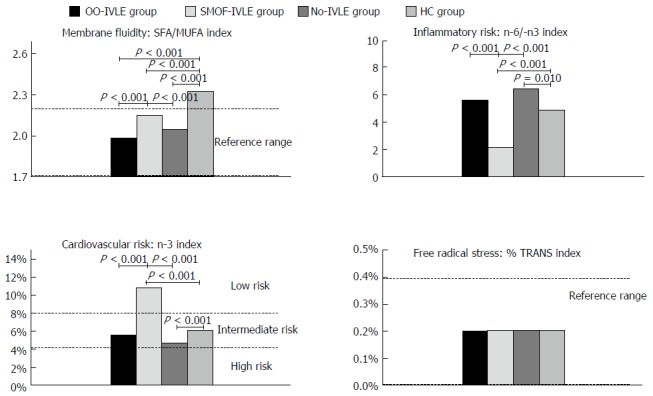
Figure 4.

Molecular biomarkers. Data are expressed as medians; IVLE: Intravenous lipid emulsion; OO-IVLE group: Patients receiving a PN admixture containing Clinoleic 20%; SMOF-IVLE group: Patients receiving aPN admixture containing SMOF lipid ®20%; No-IVLE group: Patients receiving PN without IVLE; HC group: Healthy controls; SFAs: Saturated fatty acids; MUFAs: Monounsaturated fatty acids; n-3 Index: Sum of the percentages of EPA and DHA; %TRANS index: Sum of the percentages of trans isomers of oleic acid and arachidonic acid.
