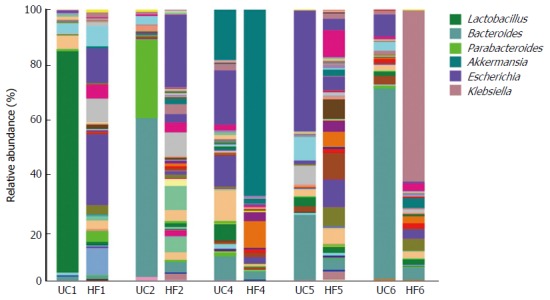
Figure 3.

Relative abundance at the genus level, as shown by 16S rRNA gene sequencing, from ulcerative colitis patients and their partners showing a microbiota imbalance. Each column represents one fecal sample and different colors indicate different genera in the microbiota composition. Microbiota with a substantial proportional imbalance are listed. UC: UC patient; HF: Healthy partners.
