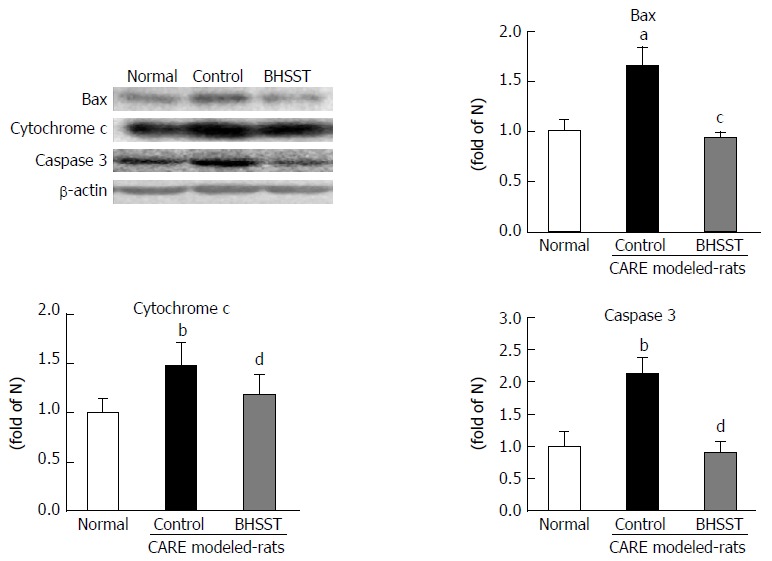
Figure 5.

Expression of bax, cytochrome c and caspase 3 in chronic acid reflux esophagitis rats. Normal, normal rats; Control, untreated CARE modeled rats; BHSST, BHSST, BHSST-treated (1 g/kg body weight per day) CARE modeled rats. Data are presented as mean ± SE (n = 6). aP < 0.05, bP < 0.01 vs normal rats; cP < 0.05, dP < 0.01 vs untreated CARE modeled-rats. CARE: Chronic acid reflux esophagitis; BHSST: Banhasasim-tang.
