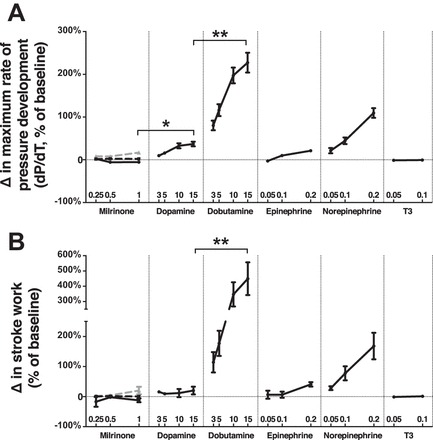
Fig. 2.

Effects on systolic function. Percentage of change in dP/dtmax (A) and stroke work (B) from an immediately preceding baseline for each dose of inotrope measured. Within milrinone group, end points were measured with milrinone alone (solid black lines) and in addition to a baseline of dopamine 5 μg·kg−1·min−1 (dashed black lines) and epinephrine 0.1 μg·kg−1·min−1 (dashed gray lines). *P < 0.05, **P < 0.01, n = 10 replicates per group. Error = SE.
