Fig. 3.

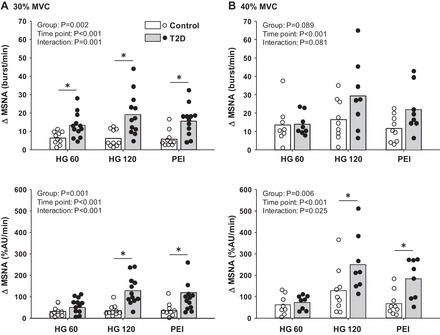
Mean and individual data showing the change in MSNA at 60 and 120 s of 30% MVC (A) and 40% MVC (B) handgrip followed by subsequent periods of PEI in T2D and control subjects. *P < 0.05 vs. control.

Mean and individual data showing the change in MSNA at 60 and 120 s of 30% MVC (A) and 40% MVC (B) handgrip followed by subsequent periods of PEI in T2D and control subjects. *P < 0.05 vs. control.