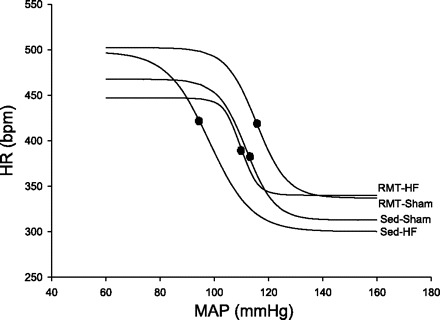
Fig. 1.

Values are means ± SD; n = 8 for all groups. Two-way ANOVA and Bonferroni post hoc test. Sed-Sham, sedentary sham rats; RMT-Sham, respiratory muscle training-Sham rats; Sed-HF, sedentary heart failure rats; RMT-HF, RMT HF rats. Plots showing the average values of the relationship between mean arterial pressure (MAP) and heart rate (HR) using logistic sigmoidal baroreceptor curve analysis. P < 0.05 comparing RMT-HF with the Sed-HF group. ∙, values related to the highest slope point of the MAP (MAP50; corresponding to the value found at 1/2 of the HR range evoked by the baroreflex response).
