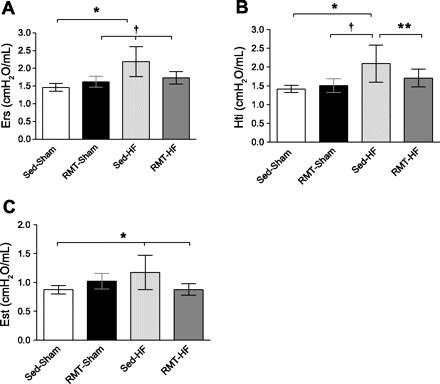
Fig. 3.

Values are means ± SD; n = 8 for all groups. Two-way ANOVA and Bonferroni post hoc test. A: Ers, respiratory system elastance (Est). *P < 0.001 compared with Sed-Sham; †P < 0.01 compared with RMT-HF and RMT-Sham. B: Hti, tissue Est. *P < 0.001 compared with Sed-Sham; †P < 0.01 compared with RMT-Sham; **P < 0.05 compared with Sed-HF. C: Est, quasistatic Est. *P < 0.01 compared with Sed-Sham and RMT-HF.
