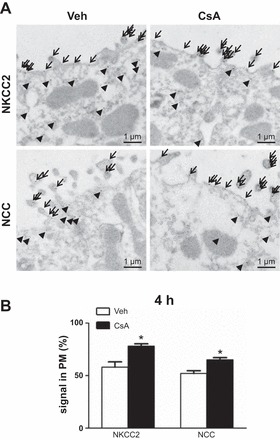
Fig. 3.

Short-term (4-h) effects of cyclosporine A on surface expression of the distal Na-K-Cl cotransporters. A: representative immunoelectron microscopic images showing cellular distribution of NKCC2 and NCC in plasma membrane (PM, arrows) vs. cytoplasm (arrowheads) in kidneys from vehicle-treated and cyclosporine A-treated rats; 5 nm gold grain labeling. B: numerical quantification of NKCC2 and NCC signals in plasma membrane/respective total cellular signals. Data are means ± SE; *P < 0.05.
