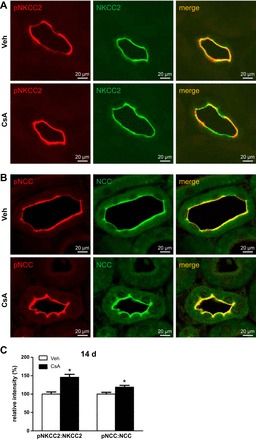
Fig. 8.

Long-term (14-days) effects of cyclosporine A on the abundance and phosphorylation levels of the distal Na-K-Cl cotransporters as evaluated by confocal microscopy. A and B: representative images of kidney sections from vehicle-treated and cyclosporine A-treated (14 days) rats showing immunofluorescent labeling of pNKCC2 and double labeling for NKCC2 in TAL (A) or immunofluorescent labeling of pS71-NCC and double labeling for NCC in DCT (B). C: graphs showing relative signal intensities of pNKCC2 and pNCC signals normalized to colocalized total NKCC2 or NCC signals as evaluated using ZEN and ImageJ software. Data are means ± SE; *P < 0.05.
