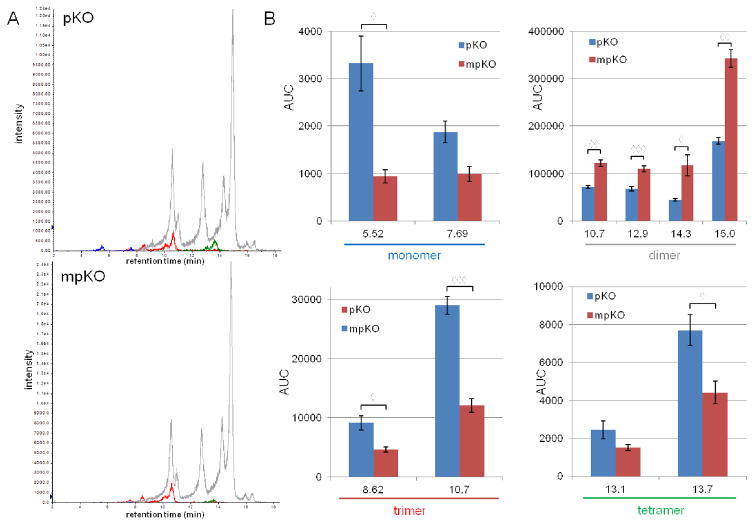
Figure 9.
HPLC-MS analysis of PACs leaching into media from treated dentin after 24 hrs. (A) Chromatogram of media exposed to pKO- and mpKO-treated dentin composed of overlaid traces of mass-mass transitions corresponding to monomers (blue, 289→137), dimers (gray, 575→449), trimers (red, 863→693), and tetramers (green, 1149→979). (B) Graphical representation of the chromatogram. Bars represent the AUC of each detected peak. Peaks are described by retention time. Average values and standard deviation of three analytical replicates are displayed. ◇, p<0.05; ◇◇, p<0.01; ◇◇◇, p<0.001 between treatments, by t-test (Bonferroni-Dunn correction).

