Figure 2.

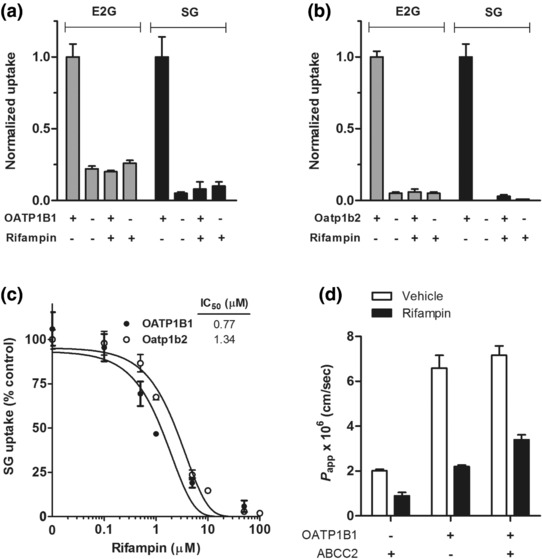
Transport of SG by OATP1B‐type transporters. Transport of estradiol‐17β‐glucuronide (E2G; 0.1 μM) and sorafenib‐β‐D‐glucuronide (SG; 10 μM) in HEK293 cells engineered to overexpress OATP1B1 (a) or Oatp1b2 (b) with or without rifampin (20 μM). All results are normalized to the transport rate in OATP1B transfected cells without rifampin, i.e., the experiments with unrestricted OATP1B effect, which were 4.77 pmol/mg protein (OATP1B1) and 26.73 pmol/mg protein (Oatp1b2) in 15 min for E2G, and 57.46 pmol/mg protein (OATP1B1) and 770.17 pmol/mg protein (Oatp1b2) in 15 min for SG. (c) Inhibition of OATP1B1 or Oatp1b2‐mediated transport of SG (10 μM) by different concentrations of rifampin (0–100 μM). Data are normalized to the relative uptake without rifampin, i.e., when the function of OATP1B is unrestricted, and represent the mean ± SE from 3–4 independent experiments (9–12 replicates). (d) Transcellular transport of SG in MDCKII cells expressing OATP1B1 and/or ABCC2. Cells were incubated with SG (1 μM), and 50‐μl aliquots were taken at 1, 2, 3, and 4 h from the compartment opposite to where the drug was added, in the presence or absence of rifampin (100 μM). Data are expressed as transporter‐mediated apparent permeability coefficient (P app) for the basolateral to apical direction (B‐to‐A). Data represent the mean ± SE (at least three replicates).
