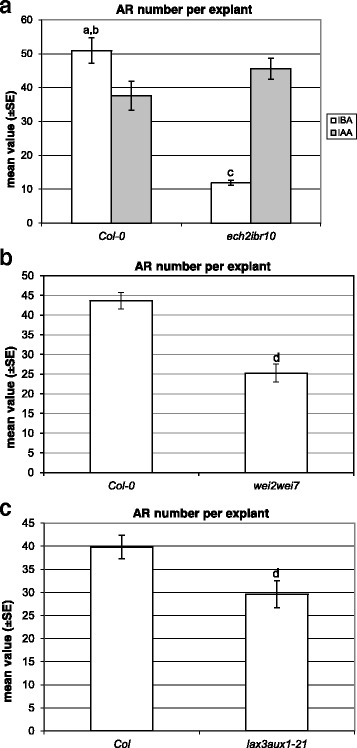
Fig. 4.

Adventitious rooting on TCLs from various genotypes cultured with IBA (10 μM) or IAA (10 μM). a Mean number (±SE) of ARs per IBA- and IAA-cultured TCL of Col-0 and ech2ibr10 at day 15. b Mean number (±SE) of ARs per IBA-cultured TCL of Col-0 and wei2wei7 at day 15. c Mean number (±SE) of ARs per IBA-cultured TCL of Col and lax3aux1 at day 15. a, P < 0.0001 difference with respect to ech2ibr10 within the same treatment; b, P < 0.05 and c, P < 0.0001 difference with respect to IAA within the same genotype; d, P < 0.01 difference with respect to the WT (Col-0 in b, Col in c). Columns with no letter are not significantly different. N = 100
