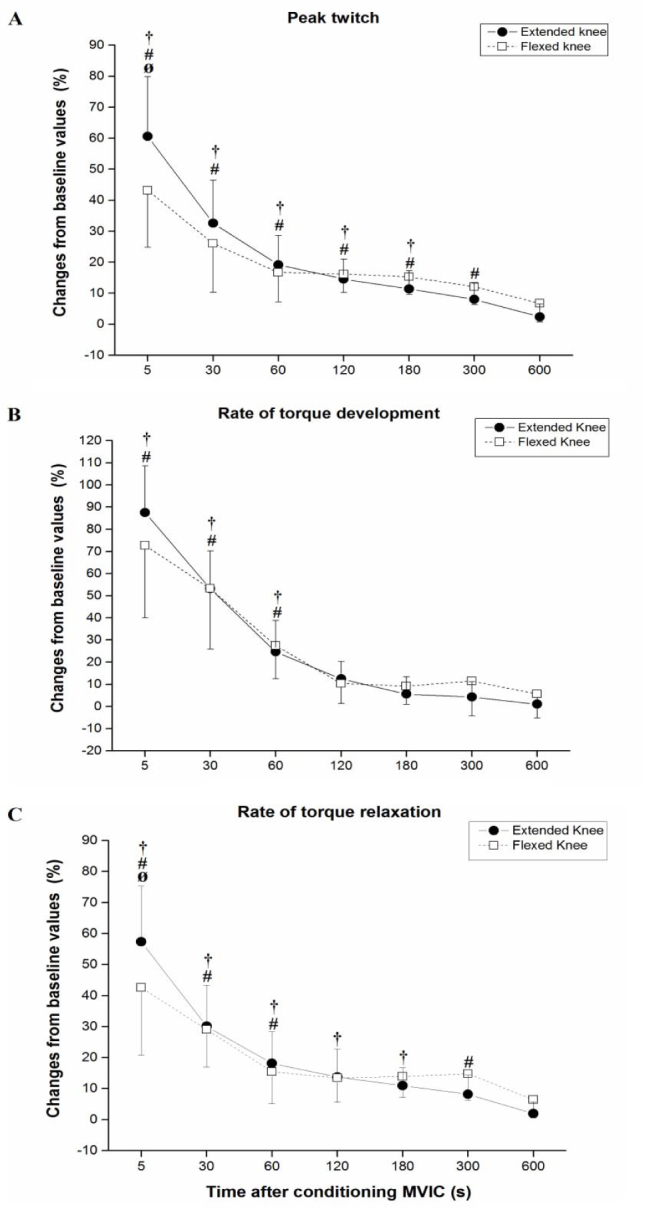
Figure 2.

(A) Peak twitch, (B) Rate of torque development and (C) Rate of torque relaxation at
different time points after the conditioning MVIC in extended (black circle) and
flexed (white square) knee position. Significant (p < 0.05) differences from control
baseline values are indicated with a † for extended knee and with # for flexed knee
position. Differences between extended and flexed knee positions are indicated with
Ø. Values expressed as percentages of baseline value are means ± SD.
