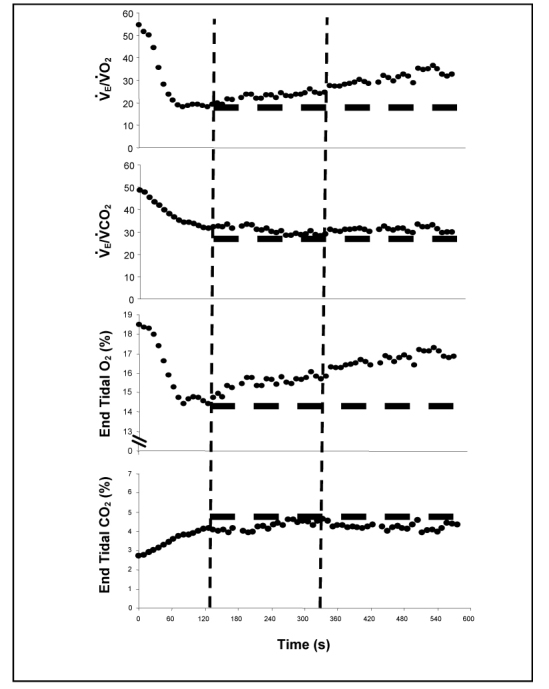
Figure 2.

Gas exchange and ventilatory responses for a representative subject during the test. From left to right, vertical dashed lines are aligned with the GET and RCP, respectively. Horizontal dashed lines are positioned at the nadir (top three panels) or apex (bottom panel) of data points.
