Fig. 1.

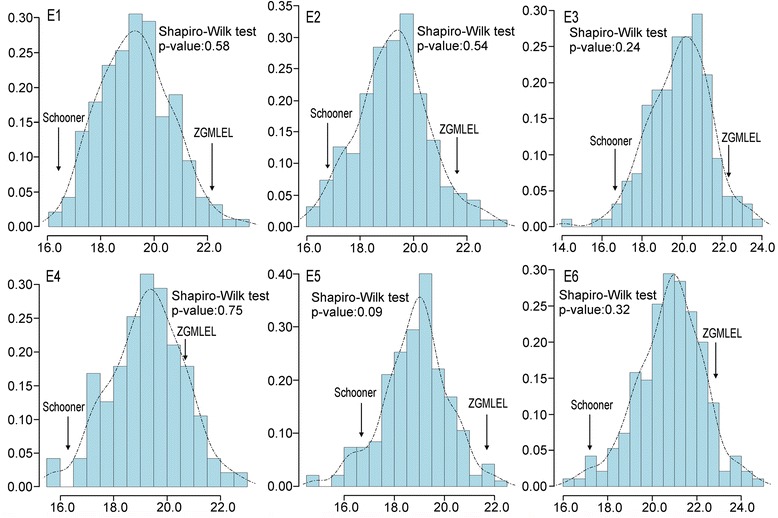
Histogram for grain protein concentration (GPC) in the ZGMLEL × Schooner population based on the mean value collected from six environments. The Y-axis represents the density of each group. The unit of the X-axis is GPC data

Histogram for grain protein concentration (GPC) in the ZGMLEL × Schooner population based on the mean value collected from six environments. The Y-axis represents the density of each group. The unit of the X-axis is GPC data