
Fig. 3.
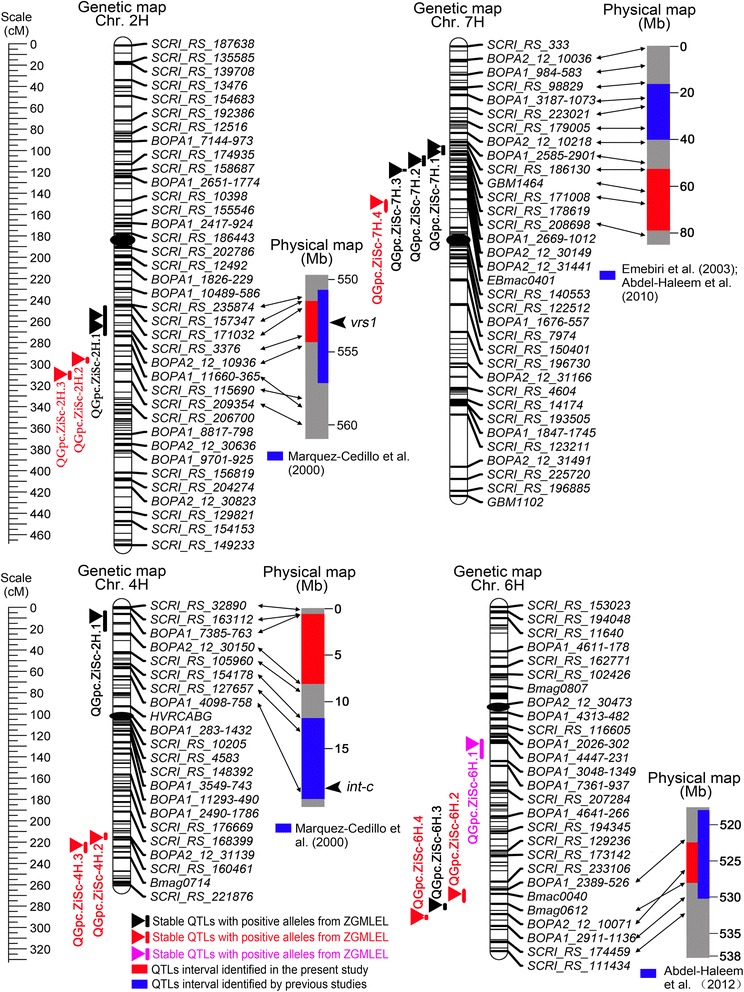
QTL locations for grain protein concentration (GPC) in the ZGMLEL × Schooner population. A centiMorgan (cM) scale is shown on the left. Vertical bar represents a 2-LOD interval for each QTL. Black ellipses represent the approximate locations of the centromeres. Black triangles indicate the environmentally stable with increasing allele from ZGMLEL. Red and pink triangles represent the putative QTLs that were detected only in less than three environments with increasing allele from ZGMLEL and Schooner, respectively. Blue and red shadows on the physical map represent the approximate positions of the QTL identified in previous studies and the present study, respectively. References from previous studies are presented under the physical map. The known positions of the vrs1 and int-c loci are shown with black arrows (Ramsay et al. [72])