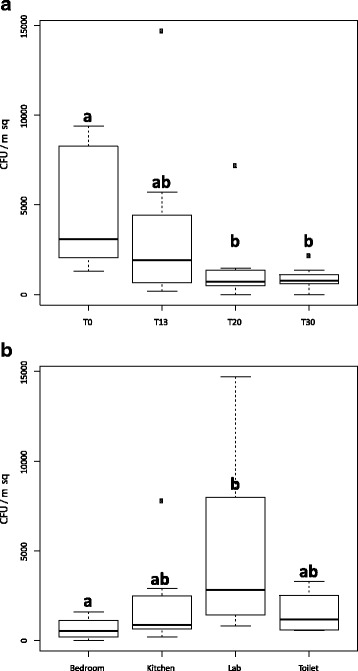
Fig. 2.

Statistical analysis of cultivable fungal diversity detected through the 30-day habitation period at all the locations based on colony-forming unit (CFU) counts. To assess the difference between fungal abundances in cultivable sample categories (based on time—A and location—B), we applied the following univariate statistics. The normal distribution of the populations were tested using Shapiro-Wilk normality test, and as most of them were not normally distributed (p value <0.05), we used a Kruskal-Wallis test coupled to a Dunn’s test to investigate differences in the tested populations. Resulting p values were corrected using the Benjamini-Hochberg correction. A CFU counts before crew occupation T0—a were statistically different from CFU counts at T20 and T30—b, but no statistical difference was observed between T0 and T13 counts—ab. Additionally, no statistical differences were observed between any other time points. B CFU counts in the bedroom—a, differed significantly from the CFU counts in lab—b, but no statistical differences were observed between bedroom and kitchen or toilet—ab. No statistical differences were observed between any other locations
