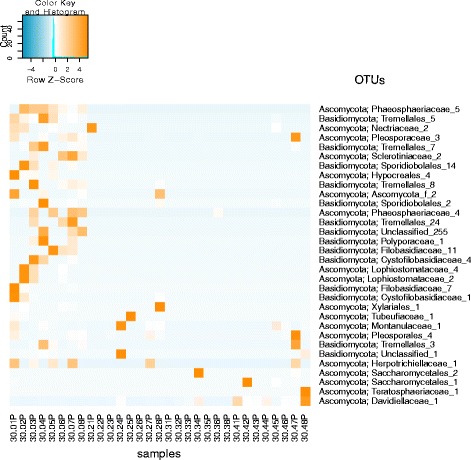
Fig. 8.

Heat map of the taxa that showed a significant correlation (p value 0.01) with the factor time in the PMA-treated sample set. The color blue indicates a low abundance of the single OTU in the respective sample, and orange indicates a high abundance of the single OTU in the respective sample. Each column represents one sample collected throughout the study. The numbering pattern is explained as follows 30 means 30-day study. The first number (0–4) will be the sample collection day (0 = T0, 2 = T13, 3 = T20, 4 = T30), second number (1–8) will be sampling location, and P stands for PMA-treated samples. For example, 30.06P will be a sample collected during the 30-day study from T0 at location 6
