
Fig. 1.
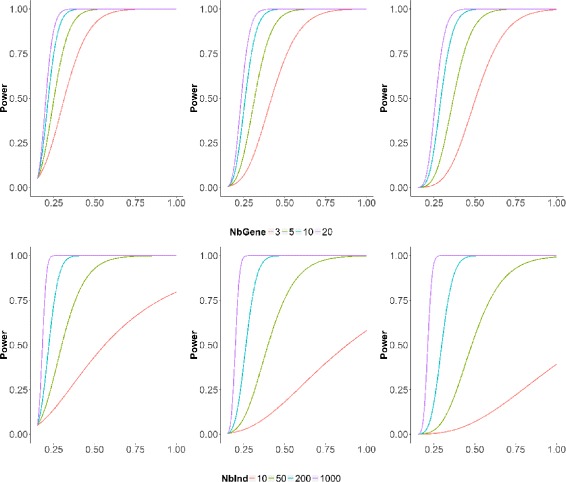
Theoretical Power. Top: Power curves as a function of ρ, for a fixed cohort size n=100 and varying region width p 0=3,5,10,20. Bottom: Same graphs for a region of fixed width p 0=5 but varying cohort sizes n=10,50,200,1000. In all graphs ρ 0 is fixed at 0.15. The nominal level α of the test is set to 5% (left), 0.5% (center), 0.05% (right)