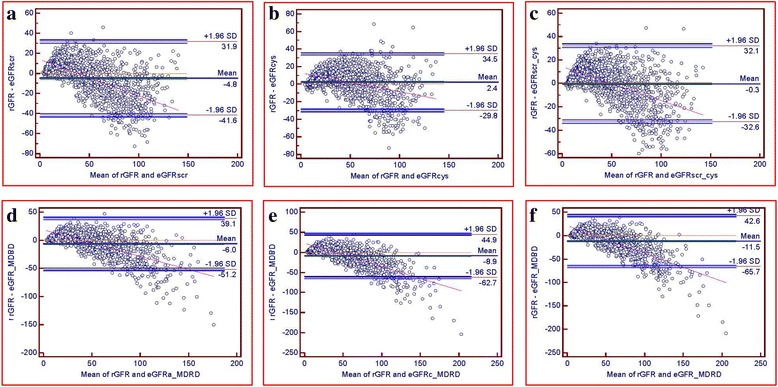
Fig. 1.

Bland-Altman plots of the rGFR and eGFR (mL/min/1.73 m2). eGFRcys and eGFRscr_cys performed similarly, showing the tightest limits of agreement among the six equations. eGFRscr_cys showed the least bias among the six equations. eGFRscr (a), eGFRcys (b), eGFRscr_cys (c), eGFRa_MDRD (d), eGFRc_MDRD (e), and eGFR_MDRD (f)
