
Fig. 3.
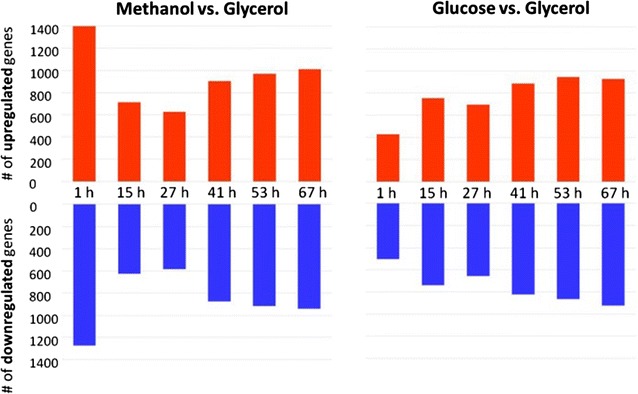
Number of differentially regulated genes (up or down) in the methanol or glucose fed-batch compared to the glycerol fed-batch. The x-axis shows the time course of methanol and glucose fed-batch in h
Official websites use .gov
A
.gov website belongs to an official
government organization in the United States.
Secure .gov websites use HTTPS
A lock (
) or https:// means you've safely
connected to the .gov website. Share sensitive
information only on official, secure websites.
Number of differentially regulated genes (up or down) in the methanol or glucose fed-batch compared to the glycerol fed-batch. The x-axis shows the time course of methanol and glucose fed-batch in h