
Fig. 5.
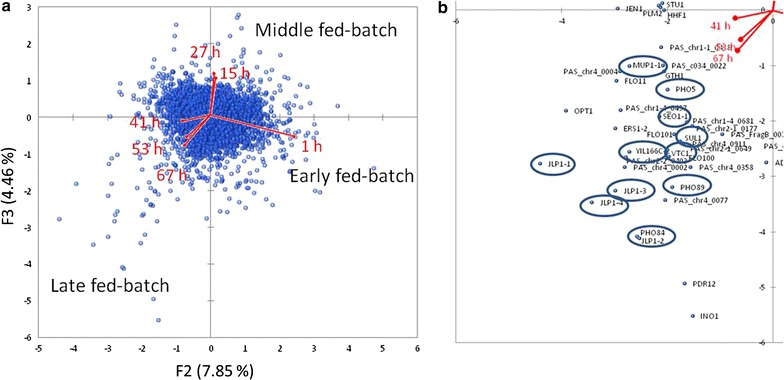
Principal component analysis (PCA) bi-plots of the methanol fed-batch (1, 15, 27, 41, 53 and 67 h after starting the methanol fed-batch) referred to the glycerol fed-batch (log2 fold change). a Vectors indicate variables (sampling time points) and blue data points indicate individuals (genes). b Excerpt from quadrant 4 with genes that were strongly regulated in the later fed-batch phase (reduced for individuals with variance below 2%). Genes involved in metabolism of nitrogen, phosphorus and sulfur are highlighted by circles