Fig. 12.

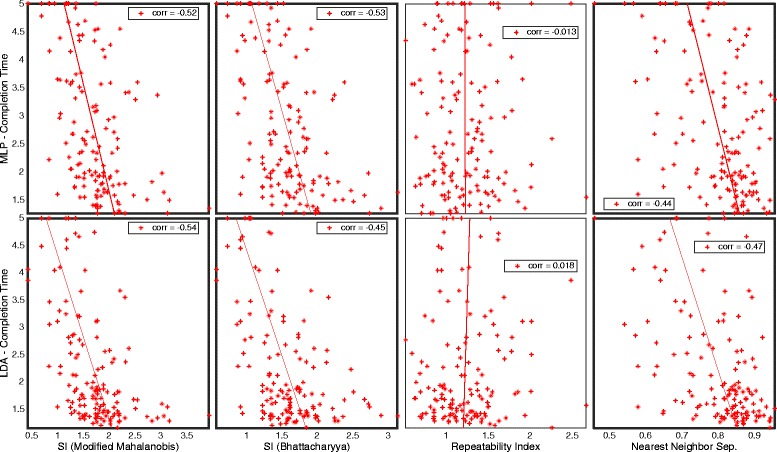
Real-time correlation for Classification Complexity Estimations. Plot matrix where the insets are completion time plotted against classification complexity estimates. Significant correlation (p < 0.001) is highlighted with bold frame

Real-time correlation for Classification Complexity Estimations. Plot matrix where the insets are completion time plotted against classification complexity estimates. Significant correlation (p < 0.001) is highlighted with bold frame