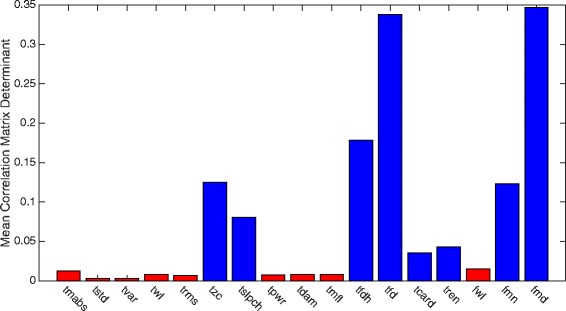
Fig. 15.

Channel disassociation for features individually. Bar diagram showing the determinant of the correlation matrixes for sets of feature sequences, where one feature was extracted from all channels. The values are averages over all subjects in the simultaneous movement data set. The feature algorithm used is stated at the horizontal axis. A high value means low correlation between channels for the specific feature. The features are divided into two groups depending on their channel correlation. Red means high correlation, while blue means low
