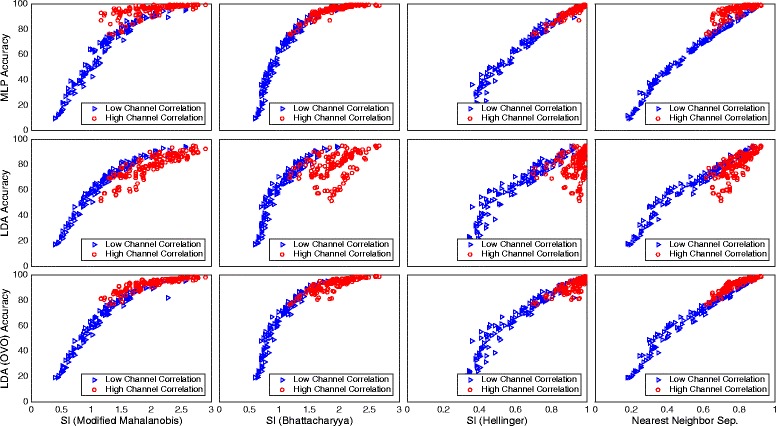
Fig. 16.

Channel correlation dependency for different classification complexity estimating algorithms. Illustration of how the two feature groups in Fig. 15 cluster in classification accuracy against classification complexity estimate plots. The red and blue groups result in high and low channel correlation, respectively. Insets in the same row show results from the same CCEA and insets in the same column from the same classifier. Classifiers were used in the conventional “single” topology, apart from LDA, which was used in “single” and OVO
