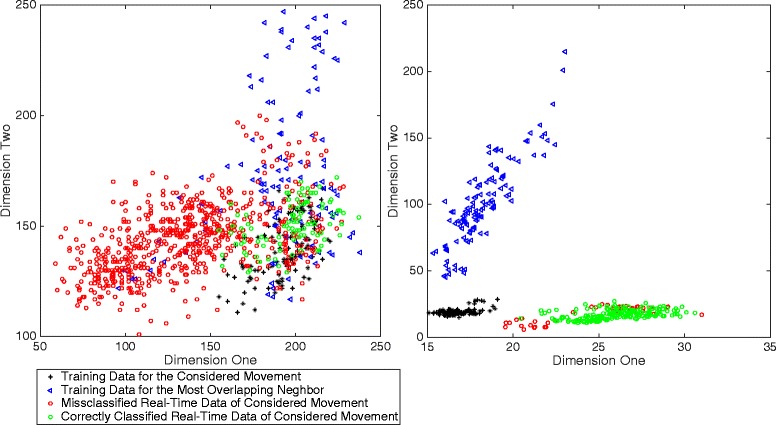
Fig. 17.

Real-time classification complexity illustration. Scatter plots of the classifier training data, together with the corresponding real-time test data. The inset to the left represents the movement with the highest average completion time of the subject with the overall highest average completion time. The inset to the right represents the movement with the lowest average completion time of the subject with the overall lowest average completion time. The plots also include the movement with the lowest modified Mahalanobis to the movement being considered. The two dimensions that are used to plot the data were selected from the 16 dimensions of the classification task so that the modified Mahalanobis between the training data and the real-time data was maximized
