
Fig. 2.
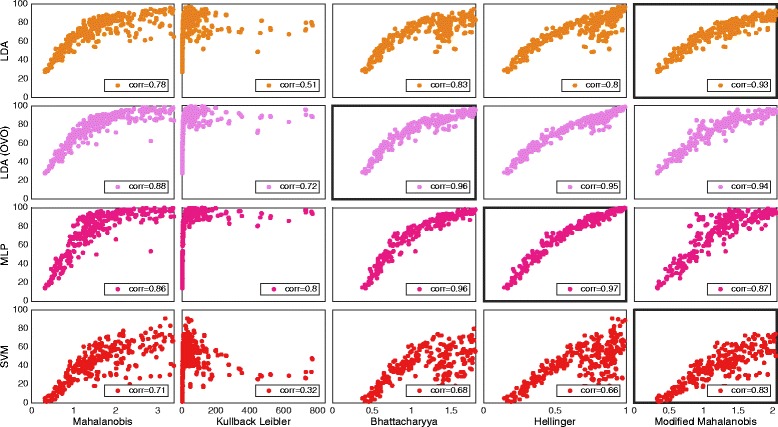
The distribution of distance definitions and classifiers data using individual movement (IM set). Plot matrix where the insets show classification accuracy plotted against the SI for the individual movements data set. One marker represents the average over all movements for one subject and one feature. The classifiers are grouped in rows and the distance definitions for the SI are grouped in columns. Classifiers were used in the conventional “single” topology, apart from LDA, which was used in “single” and “one vs. one” (OVO). All correlations were found statistically significant at p < 0.01. Classifiers and distance definitions are stated at the left side and the bottom of the plot matrix, respectively. The highest correlating distance definition for every classifier is marked by a thicker frame around the plot