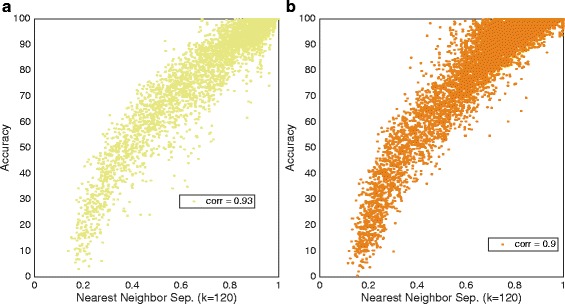
Fig. 7.

Highest correlation for NNS. LDA (OVO) classification accuracy plotted against NNS for individual result. One dot represents one movements, one subject and one feature, meaning that the number of dots is the number of movements multiplied by the number of subjects multiplied by the number of features. The plots illustrate the highest correlation from Table 4. a LDA (OVO) and IM data. b LDA AMI (OVO) and SM data
