
Fig. 7.
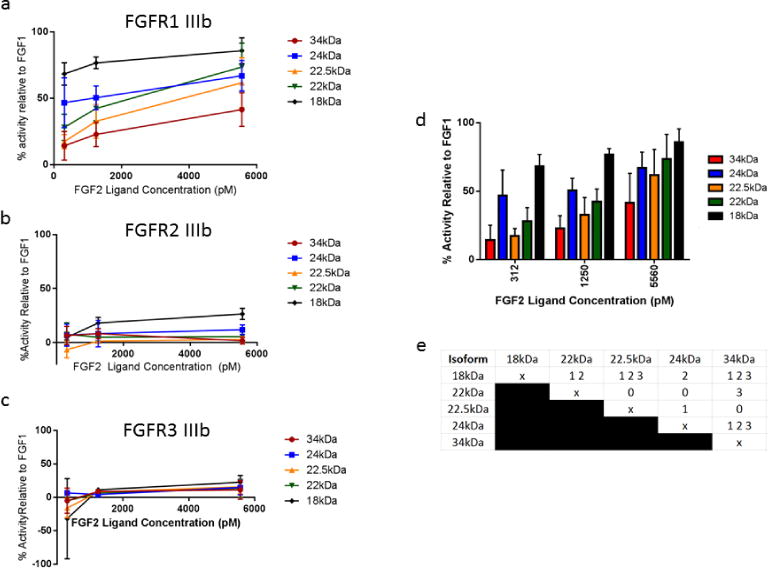
Relative mitogenic activity mediated by FGF2 isoforms. (a) Mitogenic activity was measured relative to 1250pM FGF1 for each FGF2 isoform interacting with receptor variant FGFR1 IIIb, FGFR2 IIIb, and FGFR3 IIIb at three different ligand concentrations and was quantified based on BrdU positive cells after flow cytometry analysis. (b) Mitogenic activity of individual isoforms of FGF2 for FGFR1 IIIb was compared within each ligand concentration. Error bars indicate Standard Deviation (SD). n=4 biological replicates per isoform, per ligand concentration. (c) The activity of each isoform was compared to each other isoform within each ligand concentration by an analysis of variance (ANOVA), followed by Tukey’s post-hoc pairwise comparison test. A “0” at the intersection of two isoforms in the table indicates statistical similarity between the two isoforms at all 3 ligand concentrations. A “1” indicates statistical difference at the 312pM ligand concentration. A “2” indicates statistical difference at the 1250pM ligand concentration. A “3” indicates statistical difference at the 5560pM ligand concentration. Multiple numbers in a box indicate statistical differences at more than one ligand concentration. Statistical differences were calculated with significance level α=.05.