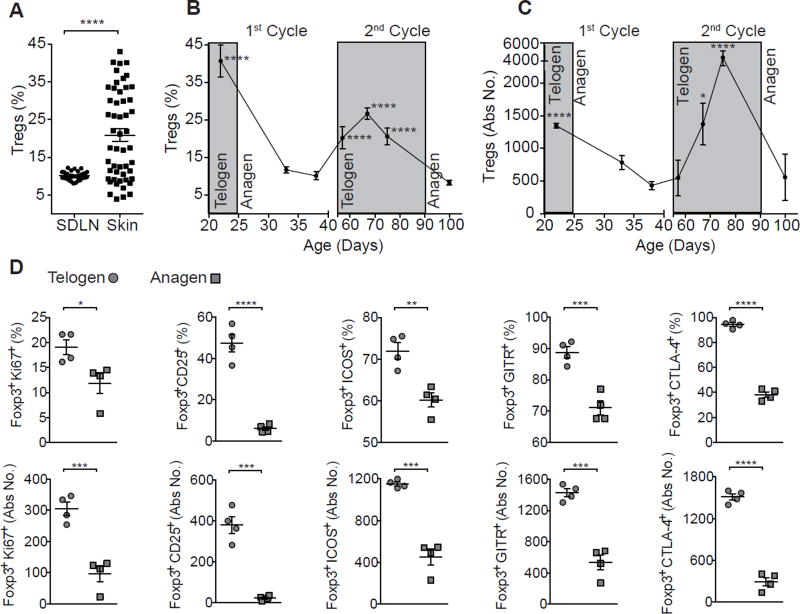
Figure 1. Treg accumulation and activation in skin correlates with the HF Cycle.
(A) Treg cell abundance in skin draining lymph nodes (SDLNs) and skin of adult 4–14 week old WT mice as measured by flow cytometry. Pre-gated on live CD45+CD3+CD4+ cells. Flow cytometric profiling of Treg (B) frequency and (C) absolute numbers from dorsal skin of C57BL/6 mice at specific stages of the synchronous HF cycle (n = 5–12 mice per time point). Shaded areas represent telogen phase and unshaded areas represent anagen phase. Treg associated activation markers were assessed: CD25, ICOS, Ki67, CTLA-4, and GITR. (D) Summary of percent and absolute cell number (Abs No.) quantification of Treg activation marker expression in telogen and anagen skin. One representative experiment of three is shown. Data are mean ± s.e.m. *P<0.05, **P<0.01 ***P<0.001, ****P<0.0001; One-way ANOVA 1st telogen vs 1st anagen and 2nd telogen vs 2nd anagen (B, C), Student’s unpaired t-test (D). See also Figure S1.

