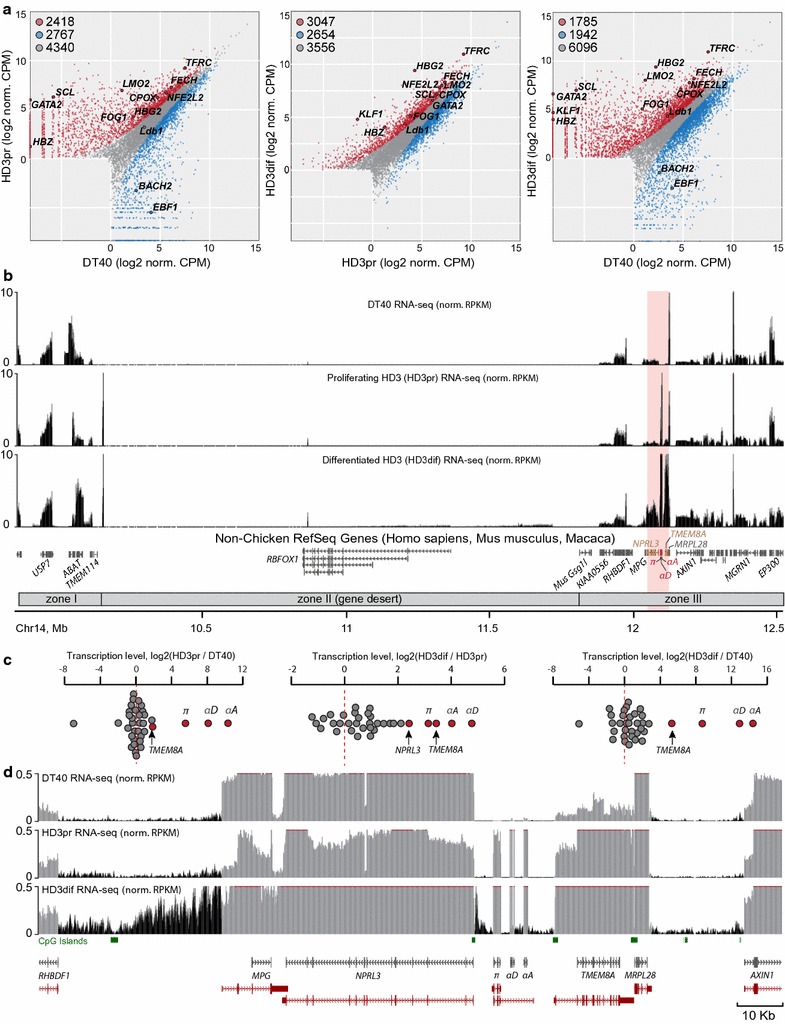
Fig. 1.

Analysis of transcriptomes of the studied cell types. a Genome-wide variation of gene expression in the studied cell types (proliferating and differentiated HD3 cells are designated by HD3pr and HD3dif, respectively). Numbers of upregulated, downregulated, and ubiquitously transcribed genes for each pair of the cell types are shown at the upper left corner of the plots. The following genes are highlighted in the plots: (1) erythroid transcription factors GATA2, SCL (Tal1), FOG1, LMO2, NF-E2, Ldb1 and KLF1 (EKLF); (2) enzymes involved in heme synthesis including FECH and CPOX; (3) transferrin receptor (TFRC); and (4) the alpha-globin gene π (HBZ) and beta-globin gene (HBG2). BACH2 and EBF1 are lymphoid transcription factors. b Normalized profiles of total rRNA-depleted RNA-seq within the studied region. The functional AgGD from the 3′-end of the NPRL3 gene to the 3′-end of the TMEM8A gene is highlighted in pink. Alpha-globin genes are highlighted in red, and non-globin genes located within the AgGD are highlighted in brown. c Transcription level changes between cell types for all genes within the studied region. d The RNA-seq profile of the AgGD and closest neighbors. Intergenic transcription profiles are highlighted in black, and genic transcription profiles are highlighted in gray. Positions of genes from the Ensembl database are highlighted in red
