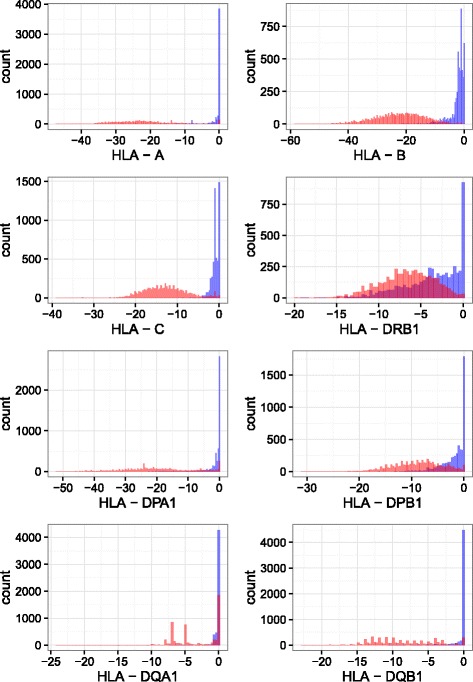
Fig. 2.

Histogram of HLA-check distance (D) distribution obtained for each HLA locus (A, B, C, DRB, DPA, DPB, DQA, DQB) comparing the actual T1DGC HLA types (blue) with a randomized set of HLA types from T1DGC (red). In the x-axis, the D value, in the y-axis, the number of subjects (genotypes) obtaining this value. For each SNP genotype, D was computed as described in the Material and Methods. One can see the clear-cut difference between the two distributions for class I HLA genes
