
Fig. 1.
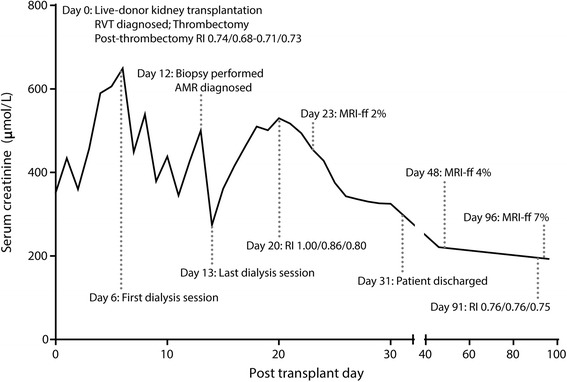
Timeline of events plotted against a graph of creatinine trajectory over time. Resistive indices are presented as upper pole/inter-polar region/lower pole. The x axis has been scaled to highlight the greater density of events during the patient’s admission (days 0–31). RVT, renal vein thrombosis. AMR, antibody-mediated rejection. RI, resistive index. MRI-ff, diffusion-weighted magnetic resonance imaging “f” fraction