
Fig. 4.
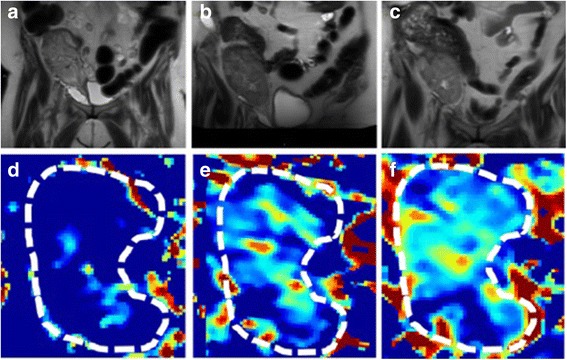
Serial diffusion-weighted MRI scans demonstrated improvements in allograft perfusion following transplant renal vein thrombectomy. (a – c) Serial conventional T2 weighted images, with grossly abnormal high T2 signal throughout the allograft parenchyma. (a) POD 22 scan. (b) POD 48 scan. (c) Scan at 3 months post-transplant vein thrombectomy. (d – e) Serial pseudocolorized perfusion (“f” fraction) maps derived from diffusion-weighted MRI images, progressing from (d) minimal perfusion on POD 22, to improved but still abnormally low perfusion (e) on POD 48 and (f) at 3 months post-thrombectomy. The color bar depicts the magnitude of the perfusion fraction, with red indicating higher perfusion, and blue indicating lower perfusion