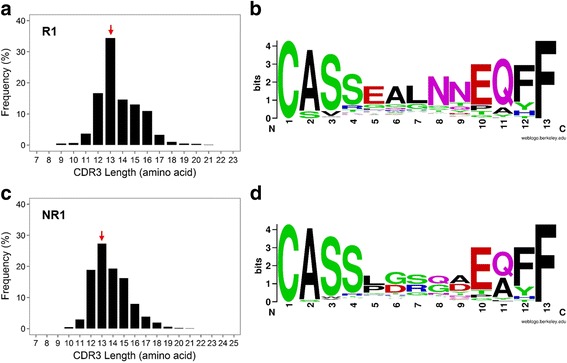
Fig. 2.

a Spectratype plot showing the distribution of T cell receptor (TCR) β complementarity determining region (CDR)3 length and their frequencies in sample R1. b 13-amino-acid CDR3 sequences of sample R1 were selected for WebLogo visualization. c Spectratype plot showing the distribution of TCR β CDR3 length and their frequencies in sample NR1. d 13-amino-acid CDR3 sequences of sample NR1 were selected for WebLogo visualization
