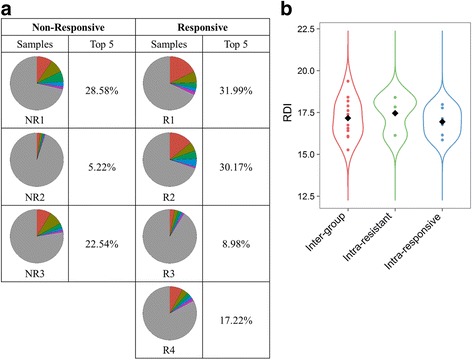
Fig. 3.

Clonal diversity of T cells in end-stage renal disease patients. a T-cell receptor (TCR) repertoires are depicted to show the individual diversity in erythropoietin (EPO) responders compared to EPO non-responders. Colors represent the abundance of each clone in percentages. b Comparison of pairwise repertoire diversity indexes (RDIs) of clonotype distribution across sample groups
