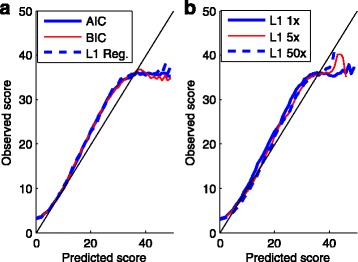
Fig. 2.

The observed quality scores versus the predicted ones by different methods and by different sizes of training sets. The predicted scores, or equivalently, the predicted error rates of the test dataset were calculated according to the model learned from the training dataset, and the observed (aka. empirical) ones were calculated as -10*log10 [(total mismatches)/(total bp in mapped reads)]. a The logistic model for scoring were trained by the three methods: backward deletion with either AIC or BIC, and L 1 regularization using a training data of 3 million bases. b The model for scoring were obtained by L 1 regularization with three different training sets, each containing 1-, 5-, and 50-folds of 3 million bases, respectively
