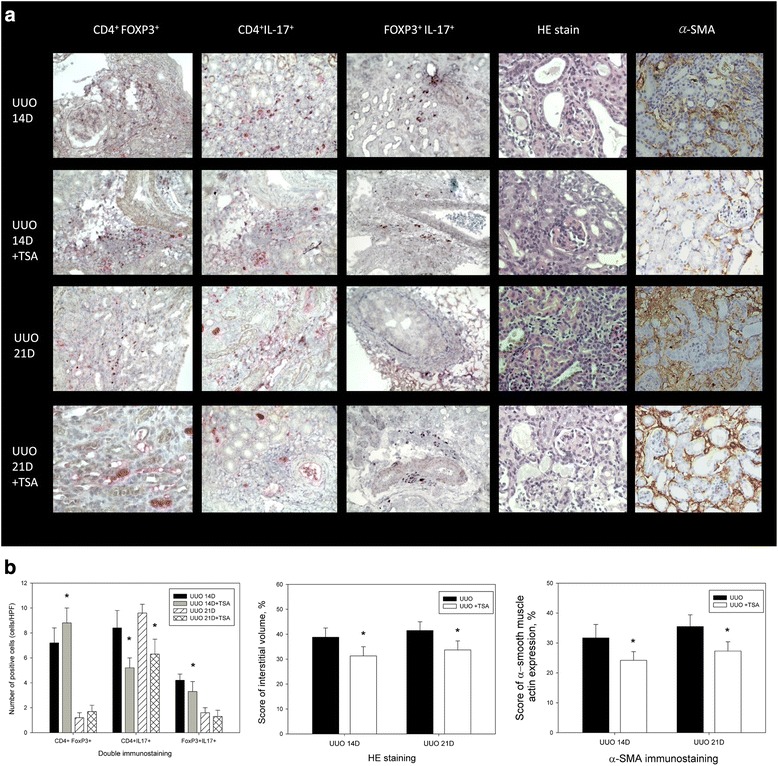
Fig. 2.

Decreased renal fibrosis after the TSA treatment in UUO. a HE staining and expression of FOXP3+IL-17+, CD4+FOXP3+, and CD4+IL-17+ T cells before and after TSA treatment in UUO groups after 14 and 21 days (400X). b The numbers of CD4+IL-17+, CD4+FOXP3+ and FOXP3+IL-17+ T cells (cells/HPF), interstitial volume score and α-SMA score in obstructed kidneys after UUO. *: p < 0.05
