Fig. 2.

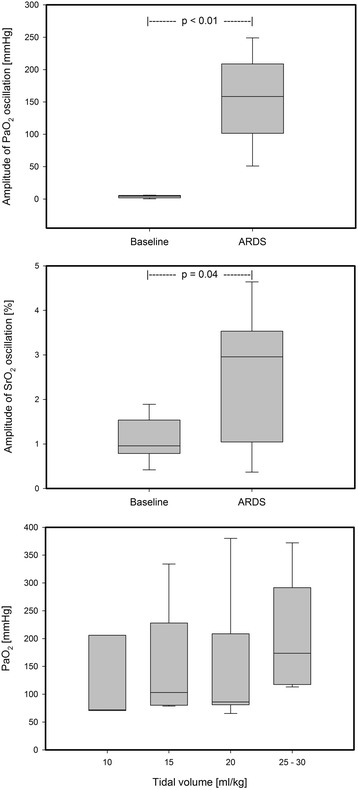
Amplitudes of PaO2 and SrO2 oscillations during cRD in comparison to the baseline values (upper graphs). PaO2measured by blood gas analysis during tidal volume down-titration (lower graph)

Amplitudes of PaO2 and SrO2 oscillations during cRD in comparison to the baseline values (upper graphs). PaO2measured by blood gas analysis during tidal volume down-titration (lower graph)