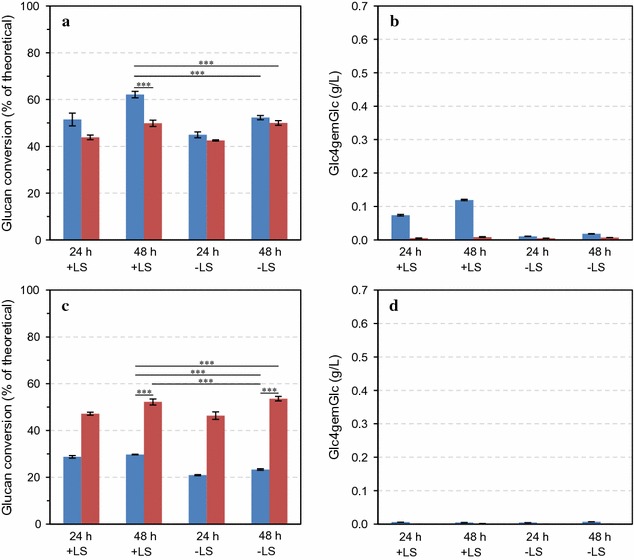
Fig. 5.

Saccharification of pretreated Norway spruce in the absence (a, b) or presence (c, d) of sulfite under aerobic (blue bars) or anaerobic (red bars) conditions, in the presence or absence of 0.25% (w/w) lignosulfonates (LS). The left panels show glucan conversion (as a percentage of theoretical glucan conversion) and the right panels show concentrations of Glc4gemGlc, at two time points. Enzymatic hydrolysis was carried out with Cellic® CTec3 at 8 mg/g glucan total protein loading in reactions containing 5% DM in 50 mM sodium acetate pH 5.0 that were incubated at 50 °C. The data points represent the average value of three independent experiments with one technical replicate per experiment. The error bars represent standard deviations of the three independent experiments. The statistical significance of differences in the 48-h saccharification yields was analyzed using two-way ANOVA with Tukey’s post hoc test (95% confidence interval) and is indicated as follows: *p < 0.05, **p < 0.01, ***p < 0.001
