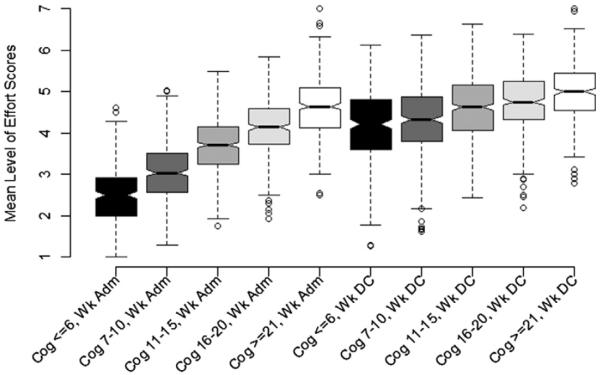
Fig 1.
Box-and-whisker plot of admission and discharge week mean level of effort rating for ST, OT, and PT sessions combined, stratified by admission FIM cognitive subscale score (N=1946). The distributions plotted represent the sample mean of patients' mean level of effort scores for all their sessions during the admission and discharge week, respectively. Patients (n=118) with ≤8 days of IR LOS were included in the admission week only. The lower and upper edges of the box represent the 25th and 75th percentiles, whereas the horizontal line in the middle of the box represents the 50th percentile (median). The dashed, vertical lines (whiskers) extending from the box indicate the range of data up to the 1.5 quartile range. Circles indicate values that extend further than 1.5 quartiles from the box. Abbreviations: Adm, admission; Cog, cognitive.

