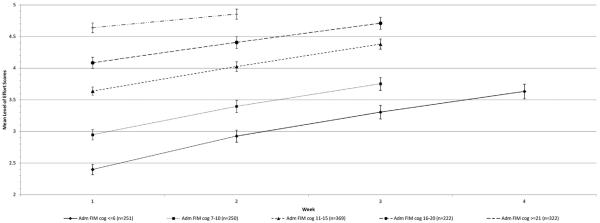
Fig 2.
Mean level of effort rating for ST, OT, and PT sessions combined for successive weeks of the stay by admission FIM cognitive subscale score category. Patients who completed at least 2, 3, or 4 weeks of IR within each of the 5 admission FIM cognitive subscale score (Adm FIM cog) groups were included in this graph. The values (different shaped dots) plotted on each line represent patients' mean level of effort scores for all their sessions during a given week. The vertical lines and error bars represent the upper and lower 95% CIs. Week is the week of IR in which patients' level of effort was rated. Abbreviation: CI, confidence interval.

